Measure your office occupancy rate and run your workspaces on real data
Attendance rates, space occupancy, remote work tracking, exceptions: the BeeMyFlex dashboard turns what your teams declare every day into reliable metrics for your real estate and HR decisions.
Personalised demo · in French · no commitment
Real estate and HR decisions made in the dark
Cutting floor space? Reconfiguring a floor? Renegotiating the remote work agreement? Without data, these six-figure decisions rest on gut feeling.
Real estate decisions made without usage data
Rent is the second-largest cost line for most companies, yet your actual office occupancy rate remains unknown. How many desks sit empty every day? Which floors are underused? No one knows.
Actual remote work goes unmeasured
The agreement allows 2 days a week, but how many days are actually worked remotely? By whom? And how is it trending? Without measurement, there is no way to bring hard facts to discussions with employee representatives.
Manual reporting drains your teams
Compiling attendance, cross-checking files, formatting a monthly report for the leadership team: hours of recurring work for data that is already out of date by the time it is published.
One complete dashboard, always-fresh data
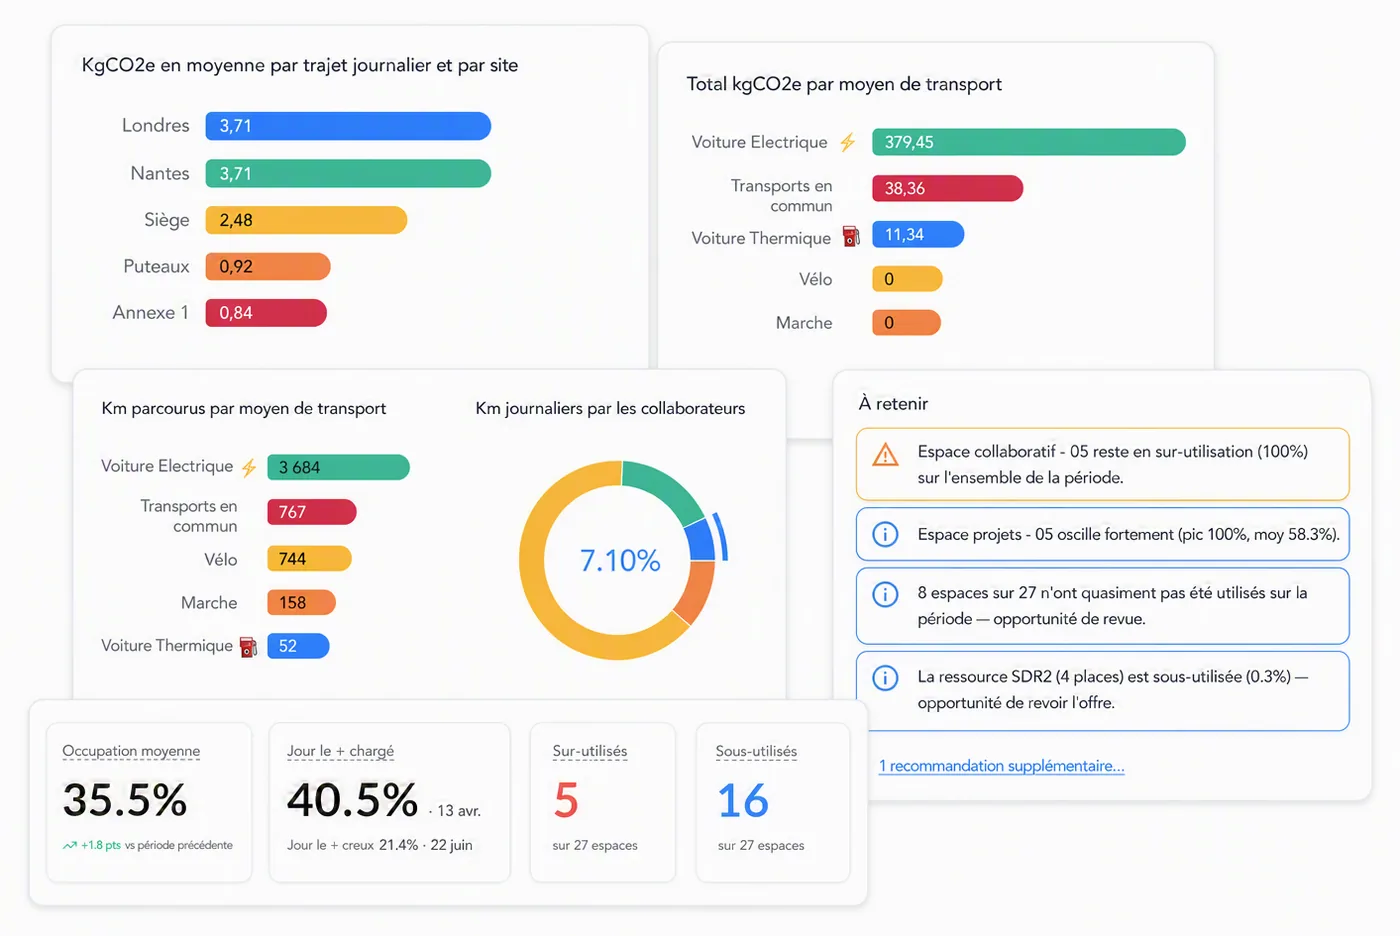
BeeMyFlex automatically aggregates attendance, booking and remote work data into actionable metrics.
Your 8 key flex office metrics
Attendance rate, office occupancy rate, schedule completion rate, remote work tracking, exception tracking, activity tracking, daily user report: everything is measured continuously and displayed visually.
- Attendance rate and office occupancy rate
- Schedule completion rate by team
- Remote work tracking: average days and trend
- Exception tracking against your rules
Analyse by site, by team, by period
Every metric can be filtered by organisation, site, team and period. Compare occupancy rates across your sites, spot the teams that are not filling in their schedules, and follow the trend month by month.
- Filtering by organisation, site, team and period
- Comparison across sites and across teams
- Trends over time for every metric
Decision-ready data
The daily user report and the exports feed your analyses: space sizing, preparation for collective bargaining, executive reporting. Mobility data (CO₂, SMA) completes the picture for your CSR reporting.
- Daily user report
- Exports for your analyses and presentations
- Complements CO₂ reporting from commute tracking
What changes with BeeMyFlex
Compare how you manage your spaces with and without occupancy data.
- Actual office occupancy rate unknown
- Real estate decisions based on gut feeling
- Actual remote work not measured
- Monthly reports compiled by hand
- Collective bargaining without objective data
- Occupancy measured continuously, site by site
- Space sizing based on real usage
- Remote work days tracked automatically
- Metrics available in real time
- Hard numbers for every discussion
How to choose your flex office software in 2026
A vendor-neutral comparison matrix, the 30 questions to ask in a demo and the mistakes to avoid: everything you need to structure your project and pick the solution that fits your company.
- The 4 evaluation areas and the 60-point scorecard
- The ready-to-use vendor comparison matrix
- The 30 questions to ask during demos
- The 8 most common mistakes to avoid when choosing
By submitting this form, you agree to receive the guide by email. No spam. See our privacy policy.
Everything you need to know about flex office
Practical guides, comparisons and advice to roll out flex office successfully in your company.
Flex office at work: the complete 2026 guide
Definition, challenges, implementation steps and mistakes to avoid: everything you need to know to roll out flex office in your organisation.
Read the article ComparisonHow to choose your flex office software in 2026
Selection criteria, must-have features, questions to ask in a demo: the method to get it right.
Read the article MethodFlex office: Excel or dedicated software?
The hidden costs of spreadsheet tracking, admin time, data entry errors and unreliable data, set against what a dedicated tool delivers.
Read the article StrategyThe benefits of flex office for your company
Lower real estate costs, more flexibility, employer appeal, CSR: the concrete benefits, backed by figures.
Read the article ImplementationHow to implement flex office
From the space audit to supporting your teams, the 7 steps to a successful move to flex office.
Read the article ComparisonFlex office software comparison 2026
An overview of the main solutions on the market: criteria, strengths and differentiators for each player.
Read the articleEverything about BeeMyFlex analytics
Answers to the questions we are asked most about this feature.
Run your workspaces on real data
See the BeeMyFlex dashboard in a demo, and the savings that reliable occupancy data can reveal.